跳至主要內容
QGIS首頁
旅遊首頁
QGIS
68.How to make Taiwan Rainfall Map using Google Earth Engine
67.Flowdirection styled with Arrow in Qgis(使用箭頭標示流向)
66.Adding 300+ basemaps to QGIS
65.Google Earth Engine 與 Qgis 的差異(JavaScript conversion python)
64.Animate Urban Growth Trends with Google Earth Engine-Google Earth Engine製作都市擴張的動畫(以台北為例)
63.Google Earth Engine to Calculate NDVI Using Landsat 9
62.翡翠水庫Reservoir Capacity Monitoring -面積(Area)和容積(Capacity)與DEM水深(Elevation)之間的關係曲線(Curves)
61.QGIS圖形scale功能_以台灣人口age index分布為例
60.水庫的DEM量測水庫面積(Area)與體積(volume)
59.Global Surface Water data set(世界地面水資料)處理_以阿富汗Kajaki Dam為例
58.河川流域的水平衡(Water Balance of Basin): Evapotranspiration(蒸發散量)
57.河川流域的水平衡(Water Balance of Basin):Precipitation(降水量)
56. DEM_ Volume Calculations
55.QGIS建立3D Model 以澳洲super pit為例
54. 製圖加入Data Plotly Graphs
53.PCRaster計算 longest distance from springs to outlet in a river network
52.SAGA計算 longest distance from springs to outlet in a river network
51.計算 Flow Accumulation in QGIS
50.Earthquake Map
49.Multi Criteria Overlay Analysis_Assam為例
48. DEM 使用 vector lines 顯示
47.都市化的界定(Drive Urban Footprint)-以台北市為例
46.Interpolate Points to Raster (Thiessen & IDW) in QGIS_以荷蘭氣溫分布為例
45.3DBuildings in Qgis_Rotterdam為例
44.Point cloud資料擷取轉換成DSM
43.世界巨大都會的分布World Largest Metropolis Distributions
42.World Population Change from 2000 to 2020
41.QGIS視域分析-Viewshed analysis_以陽明山為例
40.QGIS 中3D Tiles 和Cesium Ion 外掛_以荷蘭為例
39.下載10m解析度 digital elevation model (DEM)
38.下載世界Hydro RIVER Hydro BASIN Shapefile data _以台灣為例
37. Spatial Metrics都市土地利用分析_以Rotterdam為例
36.Los Angeles Wildfire Damage 利用衛星影像評估
35.建立3D Buildings Models in QGIS
34.Styling the Wells Map in QGIS
33.Multi Criteria Overlay Analysis (QGIS3)多準則決策分析
32.台灣空氣品質AQI指數分布(IDW內插法應用)
31.Interpolate Groundwater Quality Data in QGIS (內差法Thiessen, IDW, Kriging舉例)
30.Calculate Height Above the Nearest Drainage (HAND) with QGIS(在QGIS中計算流域的相對高度)
29.Old World Map
28.QGIS Temporal Controller以US Countries Covid-19 animation為例
27.台北地區土地利用分類-the Semi-Automatic Classification Plugin
26.荖濃溪Subcatchments-SAGA
25.荖濃溪 Subcatchments-PCRASTER
24.Smooth Stream-DEM定義的河川修飾
23.QGIS 中Semi-Automatic Classification Plugin安裝必要的更新
22.HatariUtils’ Online App更快速定義河川和流域
21.使用Graphical Modeller簡化河川和流域定義
20.陽明山山仔后坡度分級圖
19.LANDSAT8台北地區氣溫分布(LST)
18.台北地區NDVI指數分布
17.繪製台灣人口成長圖Population Growth
16.Landcover of Mosel Catchment
15.荖濃溪Catchment_White Box
14.荖濃溪catchment_PCRASTER
13.Styling flow directions Map in SAGA and GRASS
12.荖濃溪Catchment_GRASS
11.荖濃溪Catchment_SAGA
10.QGIS河川和流域定義的理論Stream and catchment delineation with GIS (theory)
9.繪製等高線Styling Contour Lines
8.土地利用Landcover 資料的擷取
7.QGIS中計算世界任何地區的人口(Population Calculated)
6.立體的DEM透過分層設色Choropleth Map與地形陰影Hillshade疊圖overlay
5.DEM資料的下載與整理
4.台灣各鄉鎮人口分佈圖資料獲取與整理
3.一般各國資料的擷取Natural Earth and GDAM
2.Locator map繪製的程序
1.QGIS中下載Natural Earth資料繪製正射投影Othographic map
旅遊
17.Amsterdam阿姆斯特丹
16.Brussel歐盟總部
15.Aachener Dom神聖羅馬帝國的首府
14.Birthplace of Jean Sibelius西貝流士的故鄉
13.Tallinn塔林-愛沙尼亞首府
12.Saint Petersburg聖彼得堡一日遊
11.Delft-Delfts Blauw荷蘭代夫特藍
10.Saxophone的原鄉-Dinant(迪南)
9.法國巴黎PARIS旅遊
1.東京輕井澤自行車體驗
8.東京賞櫻
5.河口湖逆富士-Mount FUJI
6.近藤天婦羅-米其林二星
7.Mont Saint-Michel聖米歇爾山
2.Mosel Catchment 旅遊
3.比利時布魯日Brugge
4.Antwerpen古騰堡印刷
選單
標籤
GDAM
QGIS
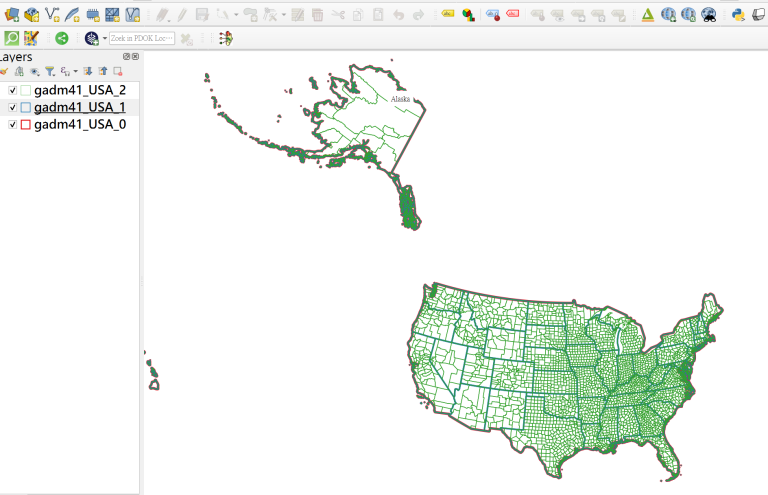
3.一般各國資料的擷取Natural Earth and GDAM
Natural Earth Downloads (1).Nature Eart…
linchenw
20 6 月, 2024