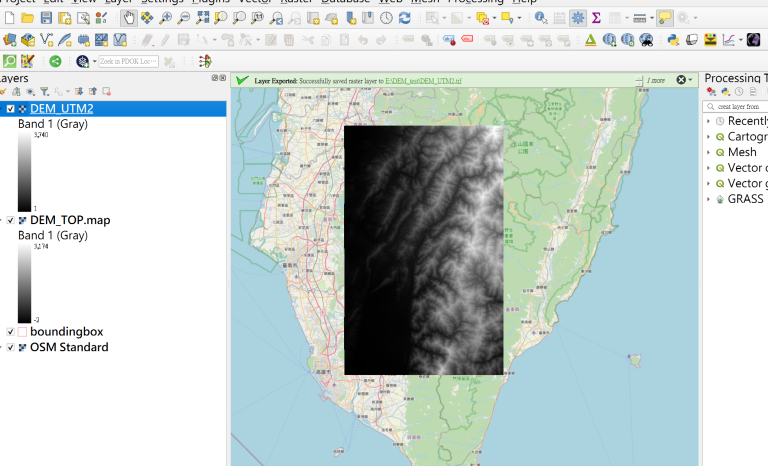
SRTM-Downlaoder (1).下載DEM可以從三個途…
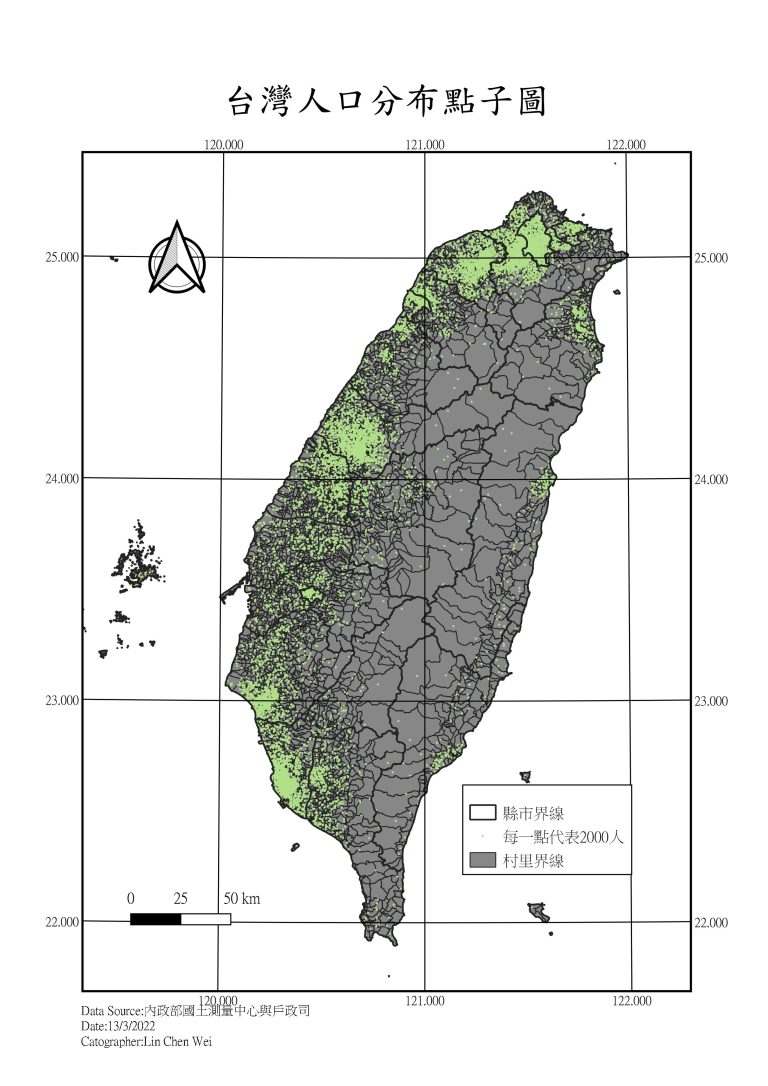
搜尋政府開放平台鄉鎮人口資料下載 (1).台…
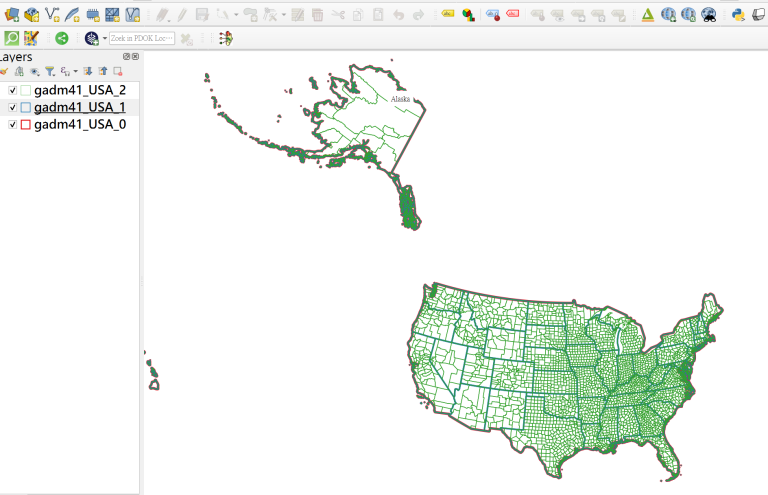
Natural Earth Downloads (1).Nature Eart…
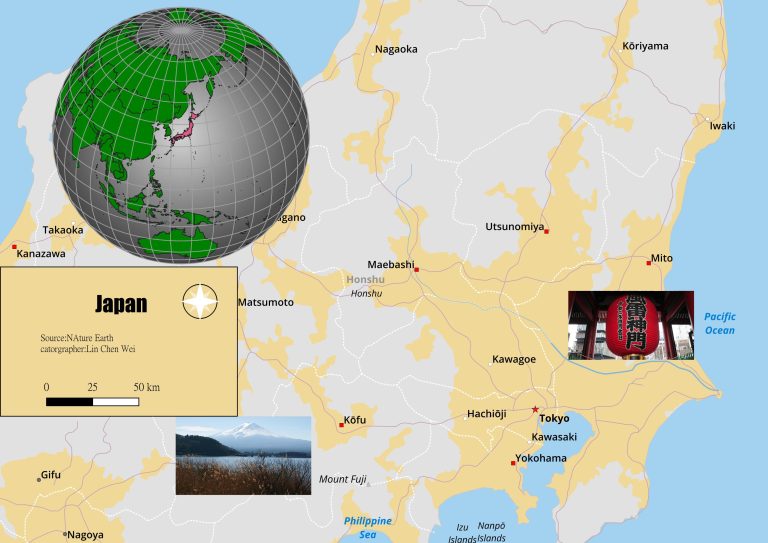
資料區分Main Map 與Locator Map (1).首先…
首先至Nature Earth網站選取下載資料:1.ne…